
This article was originally published on Built In by Eric Kleppen.
Variance is a powerful statistic used in data analysis and machine learning. It is one of the four main measures of variability along with range, interquartile range (IQR) and standard deviation. Understanding variance is important because it gives you insight into the spread of your data and can be used to compare differences in sample groups or identify important modeling features. Variance is also used in machine learning to understand changes in model performance due to using different samples of training data.
Calculating variance is easy using Python. Before diving into the Python code, I’ll first explain what variance is and how you can calculate it. By the end of this tutorial you’ll have a better understanding of why variance is an important statistic, along with several methods for calculating it using Python.
What is variance?
Variance is a statistic that measures dispersion. Low variance indicates that values are generally similar and do not vary widely from the mean while high variance indicates values are more widely dispersed from the mean. You can use variance on either a sample set or the entire population as the calculation takes in all data points in the given set. Although the calculation differs slightly when you’re looking at a sample versus population, you can calculate the variance as the average of the squared differences from the mean.

The 💜 of EU tech
The latest rumblings from the EU tech scene, a story from our wise ol' founder Boris, and some questionable AI art. It's free, every week, in your inbox. Sign up now!
Since the variance is a squared value, it can be difficult to interpret compared to other measures of variability like standard deviation. Regardless, reviewing variance can be helpful; doing so can make it easier for you to decide which statistical tests to use with your data. Depending on the statistical tests, uneven variance between samples could skew or bias results.
One of the popular statistical tests that applies variance is called the analysis of variance (ANOVA) test. An ANOVA test is used to gauge whether any of the group means are significantly different from one another when analyzing a categorical independent variable and a quantitative dependent variable. For example, say you want to analyze whether social media use impacts hours of sleep. You could break social media use into different categories like low use, medium use and high use, then run an ANOVA test to gauge whether there are statistical differences between the group means. The test can show whether results are explained by group differences or individual differences.
How do you find the variance?
Calculating the variance for a data set can differ based on whether the set is the entire population or a sample of the population.
The formula for calculating the variance of an entire population looks like this:
σ² = ∑ (Xᵢ— μ)² / N
An explanation of the formula:
- σ² = population variance
- Σ = sum of…
- Χᵢ = each value
- μ = population mean
- Ν = number of values in the population
- Using an example range of numbers, let’s walk through the calculation step by step.
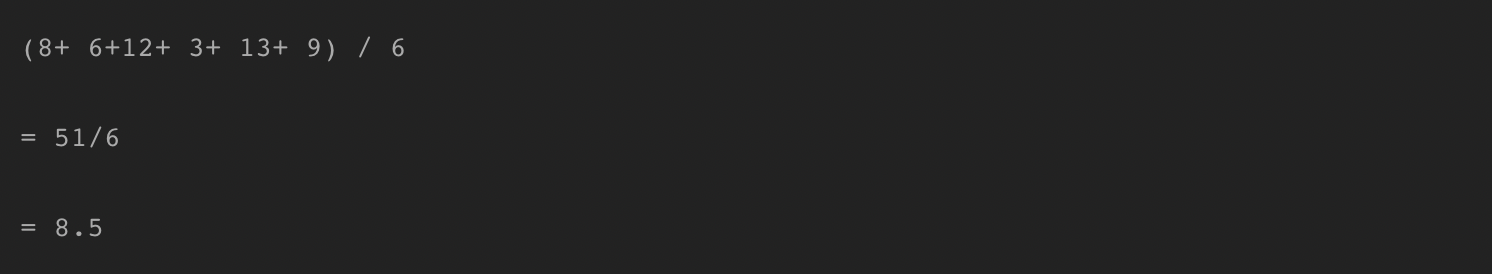
Example range of numbers: 8, 6, 12, 3, 13, 9
Find the population mean (μ):
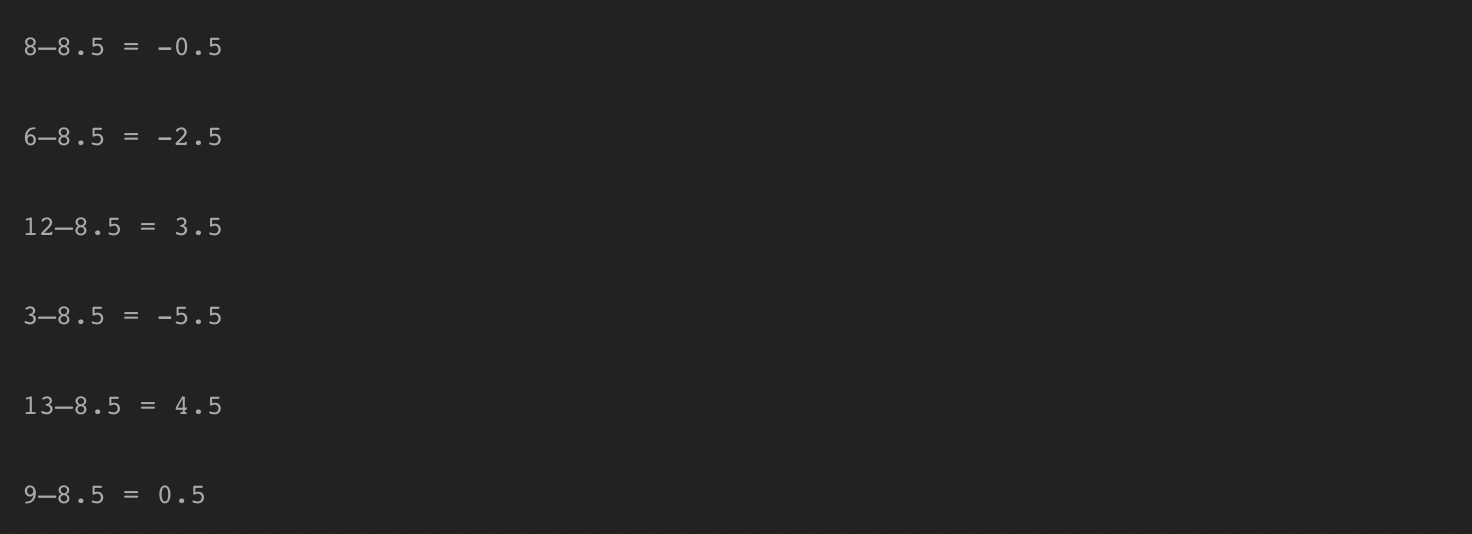
Calculate deviations from the mean by subtracting the mean from each value.
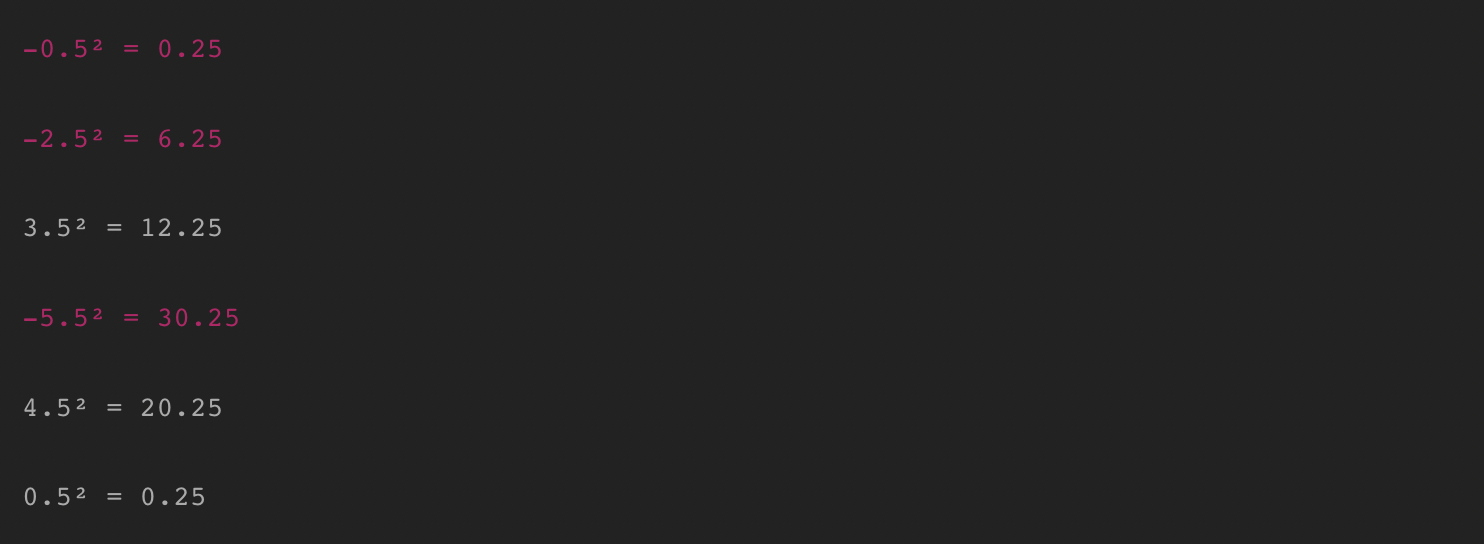
Square each deviation to get a positive number.
Sum the squared values.
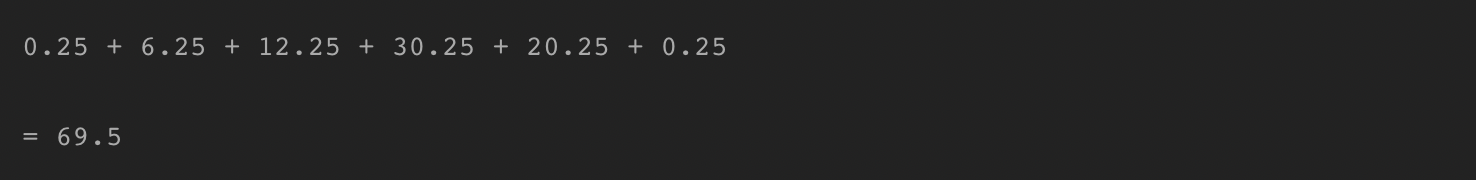
Divide the sum of squares by N or n-1.
Since we’re working with the entire population, we’ll divide by N. If we were working with a sample of the population, we would divide by n-1.
69.5/6 = 11.583
There we have it! The variance of our population is 11.583.
Why use n-1 when calculating the sample variance?
Applying n-1 to the formula is called Bessel’s correction, named after Friedrich Bessel. When using samples, we need to calculate the estimated variance for the population. If we used N instead of n-1 for the sample, the estimate would be biased, potentially underestimating the population variance. Using n-1 will make the variance estimate larger, overestimating variability in samples, thus reducing biases.
Let’s recalculate the variance pretending the values are from a sample:
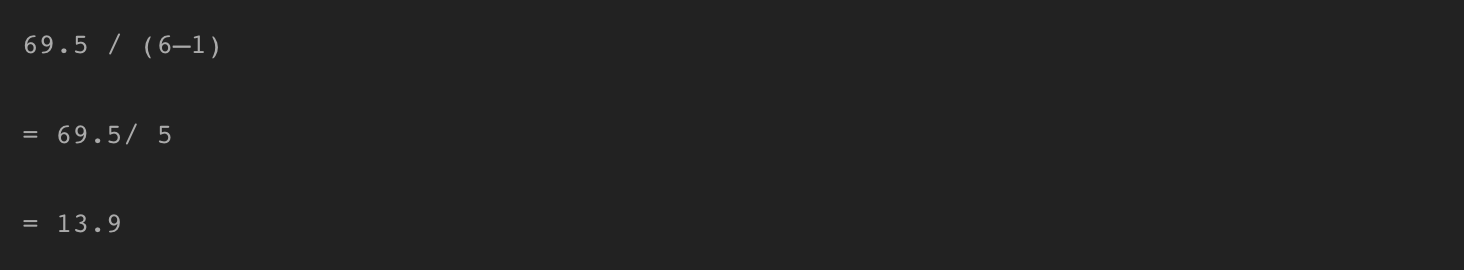
As we can see, the variance is larger!
Calculating variance using Python
Now that we’ve done the calculation by hand, we can see that completing it for a large set of values would be very tedious. Luckily, Python can easily handle the calculation for very large data. We will explore two methods using Python:
- Write our own variance calculation function
- Use Pandas’ built-in function
Writing a variance function
As we begin to write a function to calculation variance, think back to the steps we took when calculating by hand. We want the function to take in two parameters:
- population: an array of numbers
- is_sample: a Boolean to alter the calculation depending on whether we’re working with a sample or population
Start by defining the function that takes in the two parameters.

Next, add logic to calculate the population mean.

After calculating the mean, find the differences from the mean for each value. You can do this in one line using a list comprehension.

Next, square the differences and sum them.

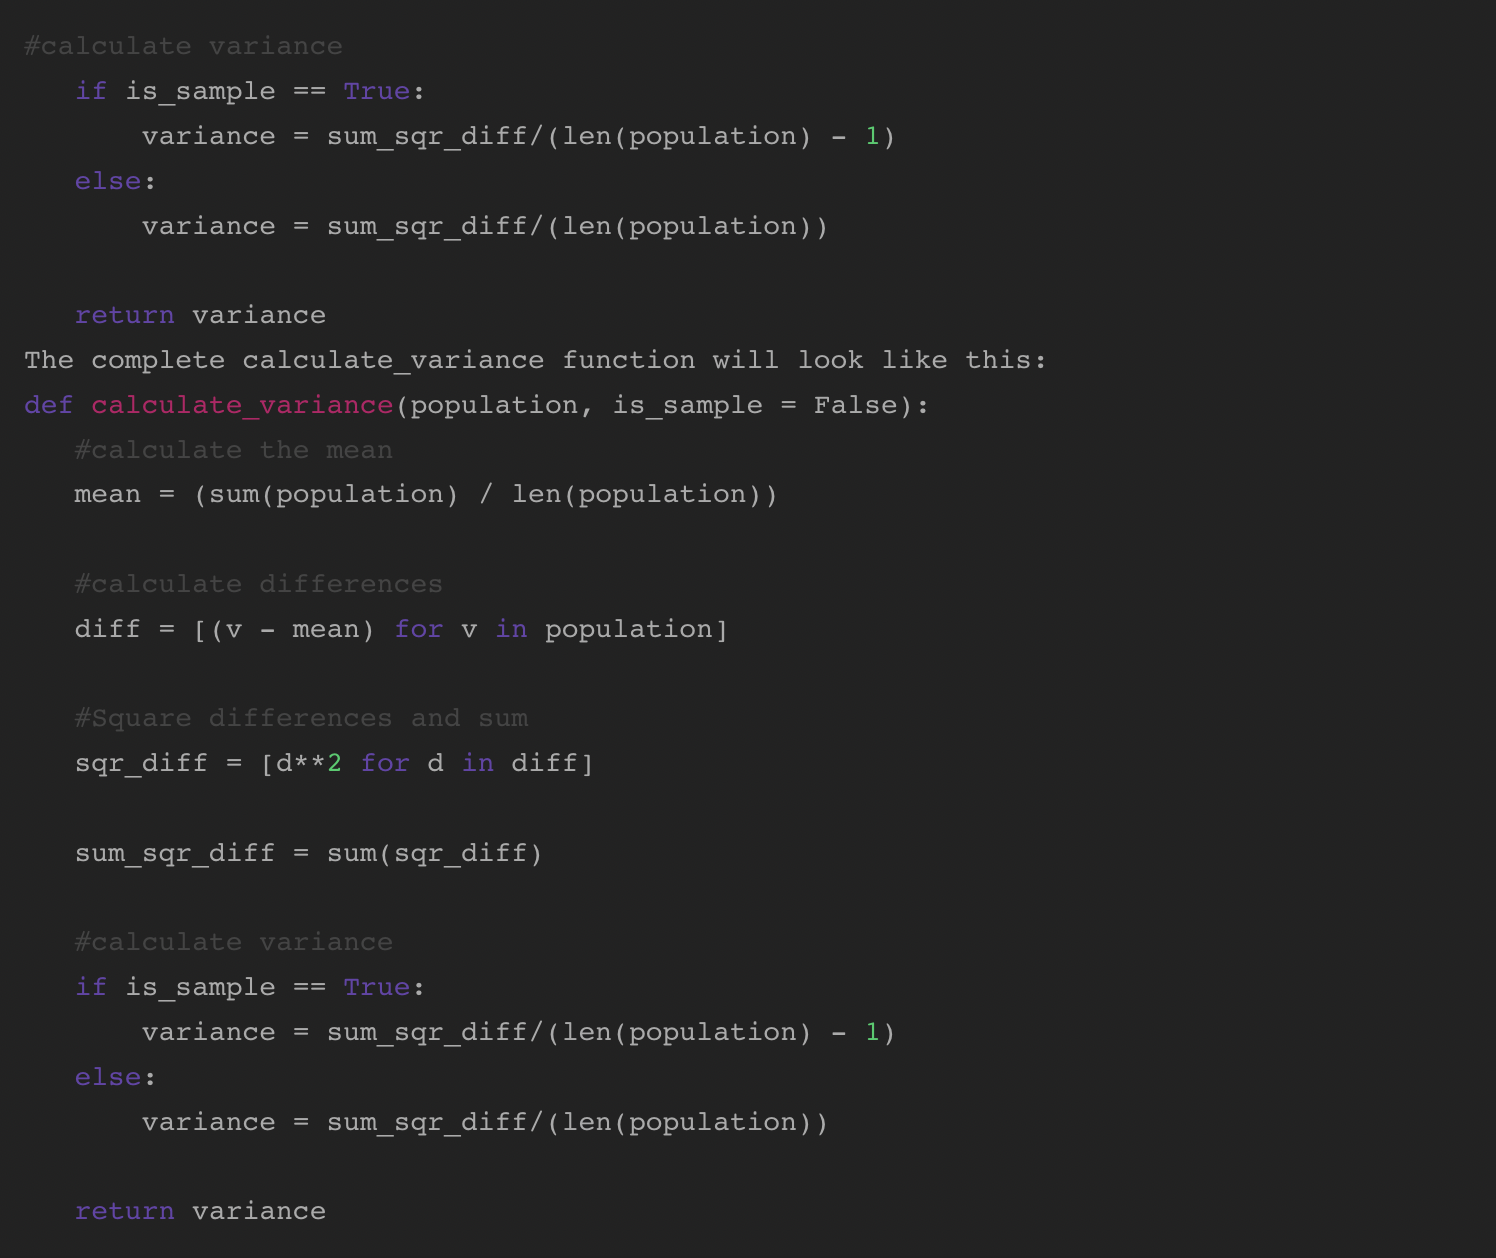
Lastly, calculate the variance. Using an If/Else statement, we can utilize the is_sampleparameter. If is_sampleis true, calculate variance using (n-1). If it is false (the default), use N:
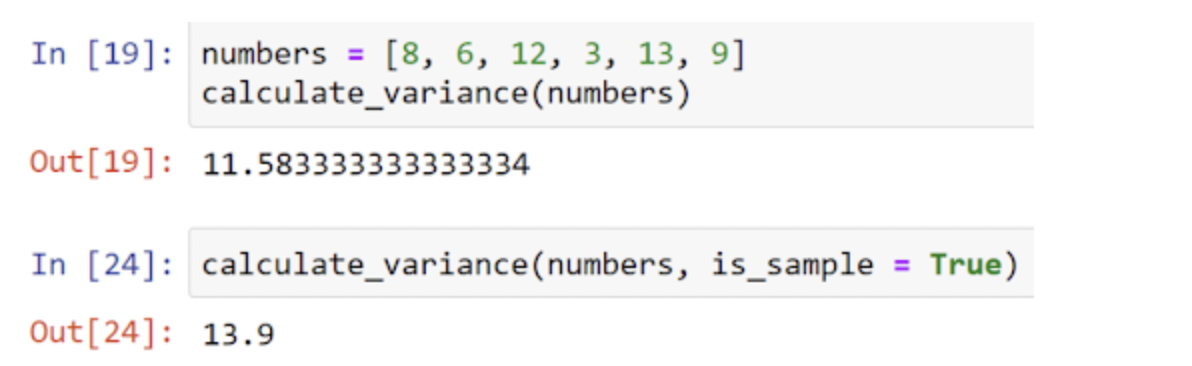
We can test the calculation using the range of numbers we crunched by hand:
Finding variance using Pandas
Although we can write a function to calculate variance in less than 10 lines of code, there is an even easier way to find variance. You can do it in one line of code using Pandas. Let’s load up some data and work through a real example of finding variance.
Loading example data
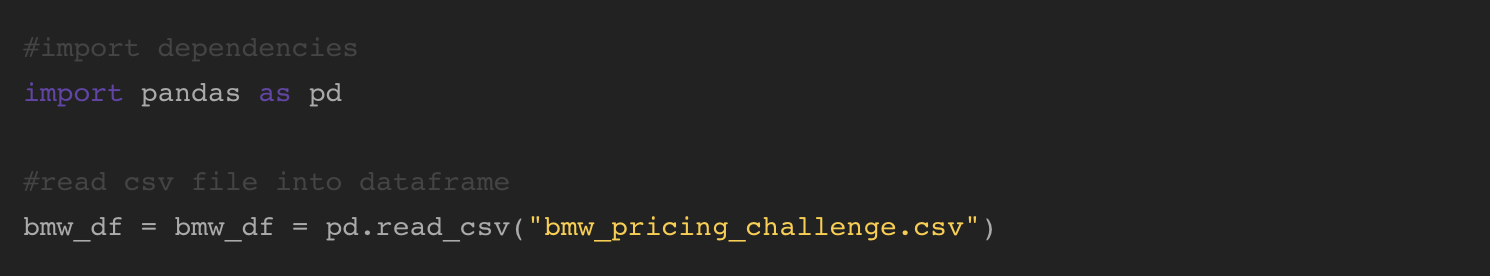
The Pandas example uses the BMW Price Challenge data set from Kaggle, which is free to download. Begin by importing the Pandas library, and then reading the CSV file into a Pandas data frame:
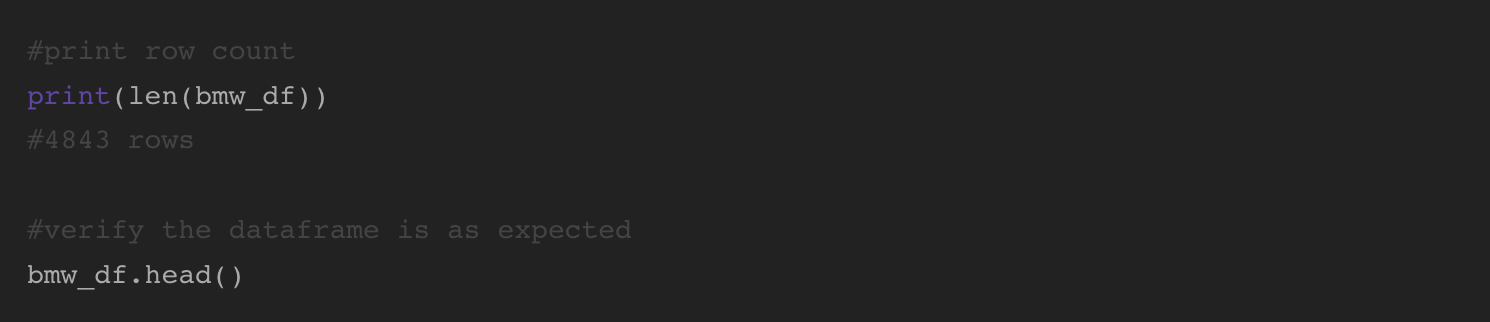
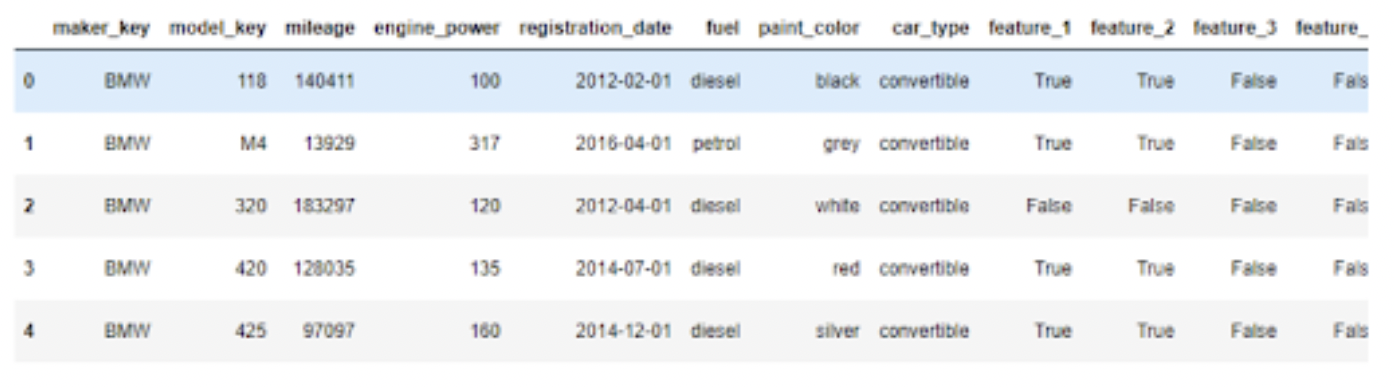
We can count the number of rows in the data set and display the first five rows to make sure everything loaded correctly:
Finding the variance for the BMW data
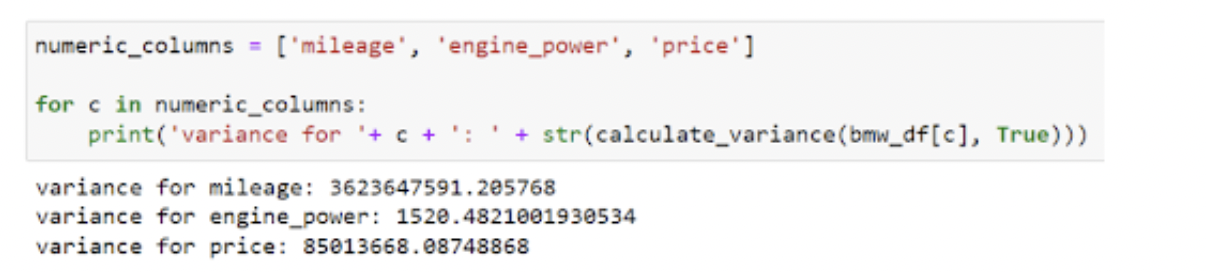
Since the BMW data set is 4843 rows, calculating that by hand would…not be fun. Instead we can simply plug in the column from the data frame into our calculate_variance function and return the variance. Let’s find the variance for the numeric columns mileage, engine_power and price.
Using Pandas var() function
In case we forget the calculation for variance and cannot write our own function, Pandas has a built-in function to calculate variance named var(). By default, it assumes a sample population and uses n-1 in the calculation; however, you can adjust the calculation by passing in the ddof=0 argument.
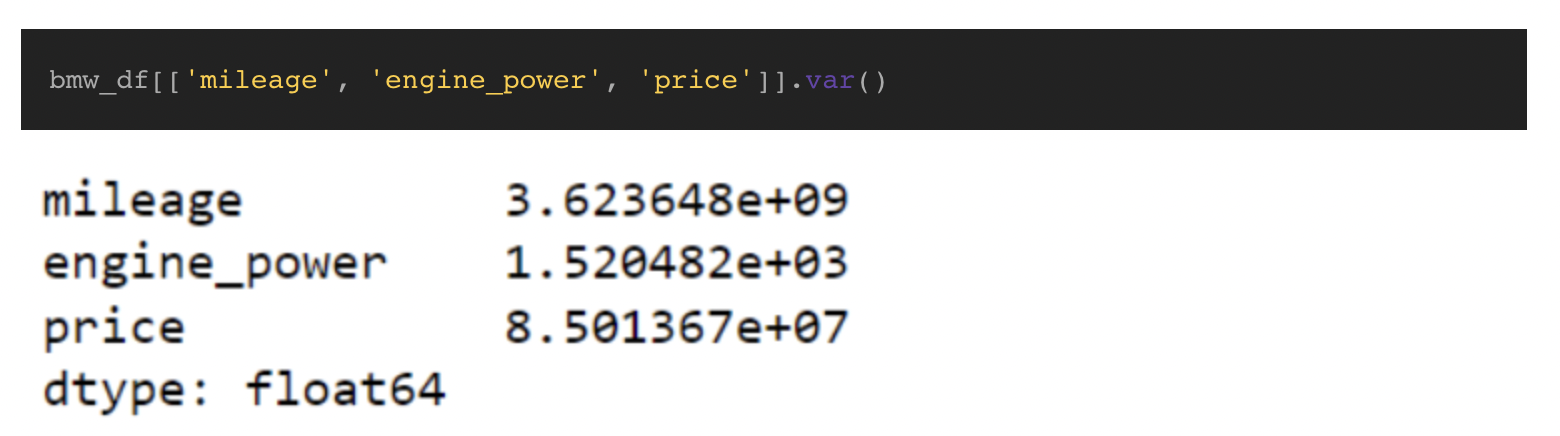
As we can see the Var() function matches the values produced by our calculate_variance function, and it’s only one line of code. Reviewing the results, we can see mileage has a high variance meaning the values tend to vary from the mean by a lot. That makes sense because many factors play into the distance a person needs to drive. By comparison, engine_power has a low variance which indicates the values don’t vary widely from the mean.
The takeaway
Understanding variance can be an important part of data analysis and machine learning because you can use it to assess group differences. Variance also impacts which statistical tests can help us make data driven decisions. High variance means values are greatly dispersed from the mean, while low variance means numbers are not widely dispersed from the mean. If we have a small set of values, it’s possible to calculate the variance by hand in only five steps. For large data sets, we saw how simple it is to calculate variance using Python and Pandas. The Var() function in Pandas calculates the variance for the numerical columns in a data frame in only one line of code, which is pretty handy!
Get the TNW newsletter
Get the most important tech news in your inbox each week.